
Node quickstart in VS Code
Set up a clear editor layout, read the local fixture's robot status, inspect joint values at a breakpoint and run the example tests. Allow about 20 minutes for the first run.
The quickstart contains the SDK, Testkit, examples, package archives and VS Code tasks. This exercise uses synthetic HORST600_S5 data on your PC; it does not connect to a physical robot.
1. Install VS Code and Node.js
- Download the Windows User Installer from the official VS Code installation page. Run it and enable Add to PATH. Open a new terminal after installation.
- Install Node.js 24 LTS from nodejs.org. The quickstart supports Node 24 (
>=24 <25). - If you want to clone the quickstart, install Git and use your fruitcore Bitbucket access. Alternatively, open your delivered Node quickstart folder.
- Check the installed tools in PowerShell:
node --version
npm --version
code --version
node --version should start with v24.. VS Code includes JavaScript/TypeScript support and the Node.js debugger.
2. Open the quickstart workspace
For a Git clone, run the following commands in your project directory. If you already have the delivered folder, open a terminal in that folder and start with npm ci instead.
git clone --branch dev --single-branch https://bitbucket.org/fruitcore/plexa-runtime-quickstarts.git
cd plexa-runtime-quickstarts/node
npm ci
code plexa-runtime-node.code-workspace
npm ci installs the SDK and Testkit from the included packages/ archives, plus third-party dependencies from the npm registry or your local cache. Keep the complete Node folder together, including .vscode/, scripts/, packages/ and the lockfile.
You can also use File → Open Workspace from File… and choose plexa-runtime-node.code-workspace inside the Node folder.
If VS Code opens in Restricted Mode, review the folder's origin. For your known quickstart, open Manage → Workspace Trust and confirm that you trust this workspace. VS Code can then run its tasks and debugger.
3. Arrange the editor
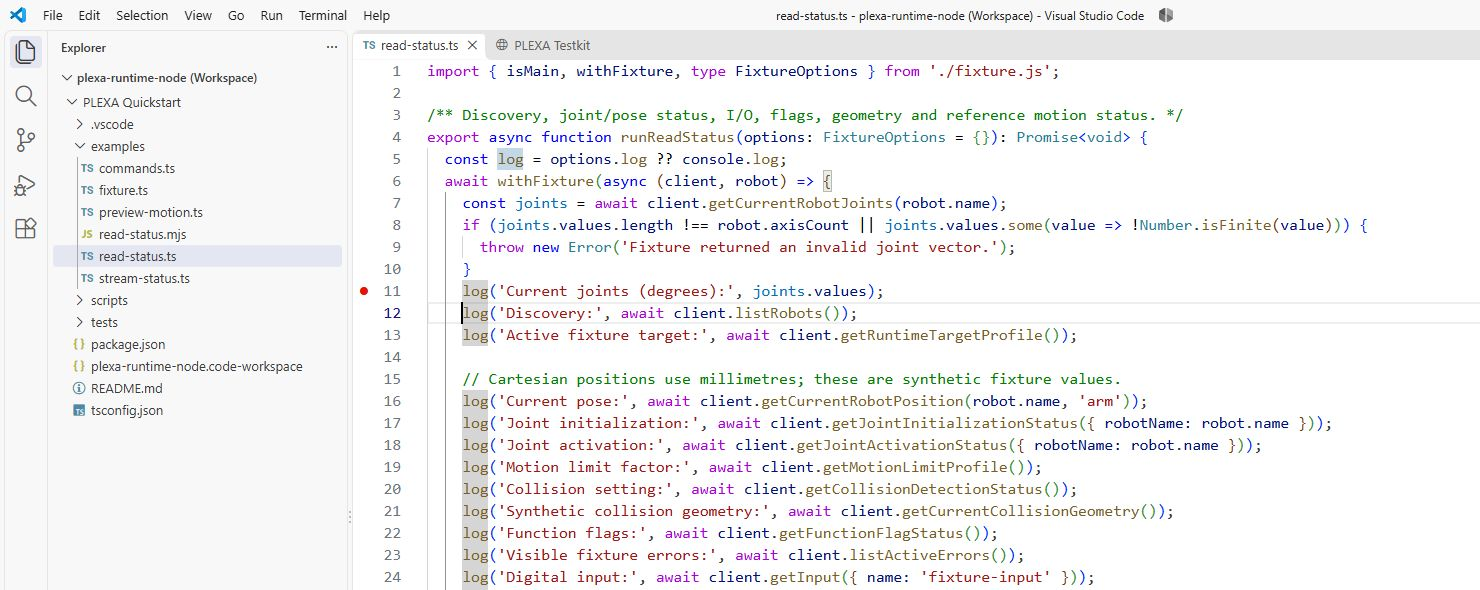
Open examples/read-status.ts in the Explorer. For a layout like the screenshots:
| Area | Setting or shortcut on Windows |
|---|---|
| Colour theme | Ctrl+K, then Ctrl+T → Light Modern |
| Explorer | Ctrl+Shift+E; keep examples/ expanded |
| Run and Debug | Ctrl+Shift+D |
| Terminal panel | View → Terminal; place it below the editor |
| Command Palette | Ctrl+Shift+P |
| Reading space | Hide the secondary sidebar with View → Appearance → Secondary Side Bar if it is open |
| Editor | In Settings, disable Editor: Minimap Enabled and use font size 16; terminal font size 14 |
Keep the code in the middle, Explorer or variables on the left, and the terminal below. Collapse node_modules/ and packages/ while working through the example.
4. Start the status debugger
- Open Run and Debug with
Ctrl+Shift+D. - Select PLEXA: Debug status (TypeScript) in the configuration list.
- Press F5.
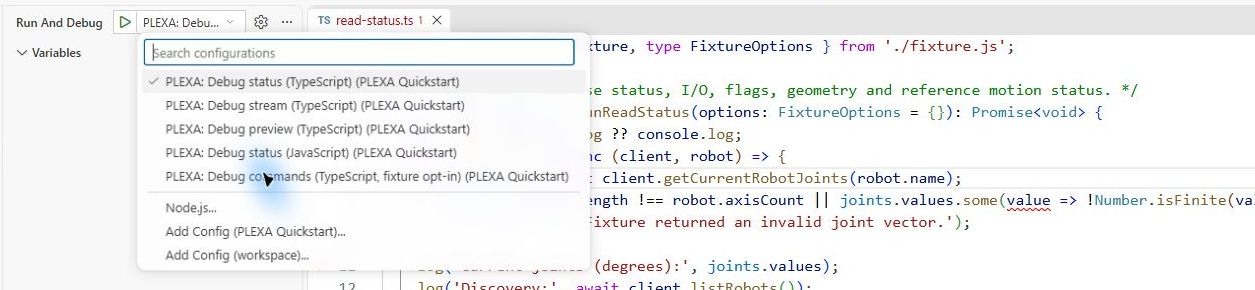
The pre-launch tasks prepare dependencies, check TypeScript and start the Testkit. Wait for its ready message, then the debugger runs the example. On the first run, package installation may take a moment.
The standard status fixture uses HTTP/WS 18041 and gRPC 19040. Let the VS Code task start it; if you started npm run testkit yourself for this exercise, stop that instance with Ctrl+C first.
Ports in the screenshots
The screenshots use a second local fixture on 18043 / 19042 alongside another session. Follow the default 18041 / 19040 addresses in this tutorial. If you change ports, keep the task arguments, readiness pattern and debug URL consistent; see Troubleshooting.
5. Inspect a breakpoint
- In
examples/read-status.ts, click the gutter beside the linelog('Current joints (degrees):', joints.values);to set a red breakpoint. In the captured version this is line 11. - Start the status profile again with F5 if it has already finished.
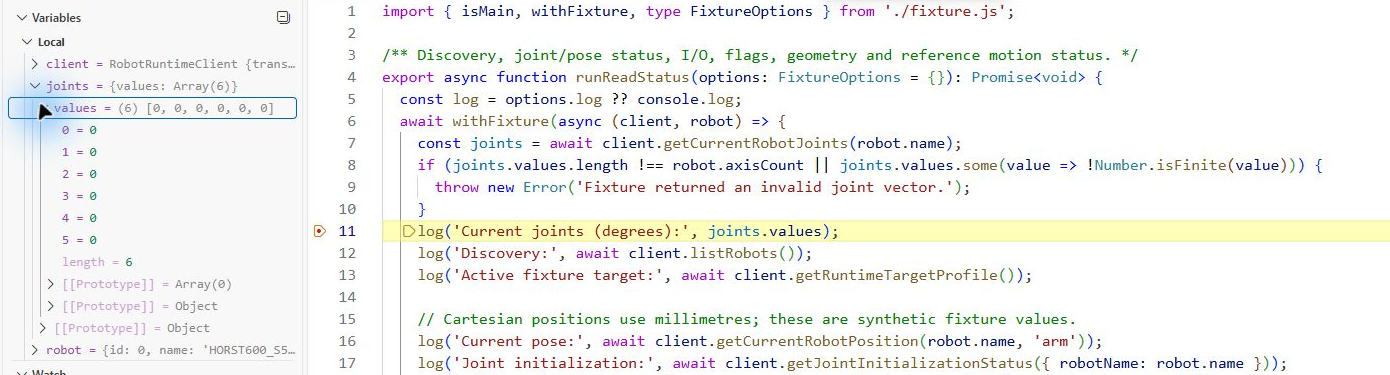
- At the yellow highlighted line, expand Variables → Locals → joints → values. You should see six finite joint values for HORST600_S5, in degrees. The captured fixture starts with six zeros.
| Key | Effect |
|---|---|
| F10 | Execute the current statement and step over to the next one |
| F11 | Step into a function call |
| Shift+F11 | Step out of the current function |
| F5 | Continue to the next breakpoint or the end |
| Shift+F5 | Stop the debug session |
Press F10 once: the joint values appear in the terminal and execution moves to the discovery statement. Then press F5 to finish. The example reads status and closes its client connection; the background Testkit task remains available.

Status read complete.6. Open the dashboard in VS Code
Keep the Testkit task running. Open the Command Palette with Ctrl+Shift+P, run Browser: Open Integrated Browser and enter:
http://127.0.0.1:18041/If your VS Code version does not offer the integrated browser, open the address in your usual browser. See the VS Code integrated browser documentation.
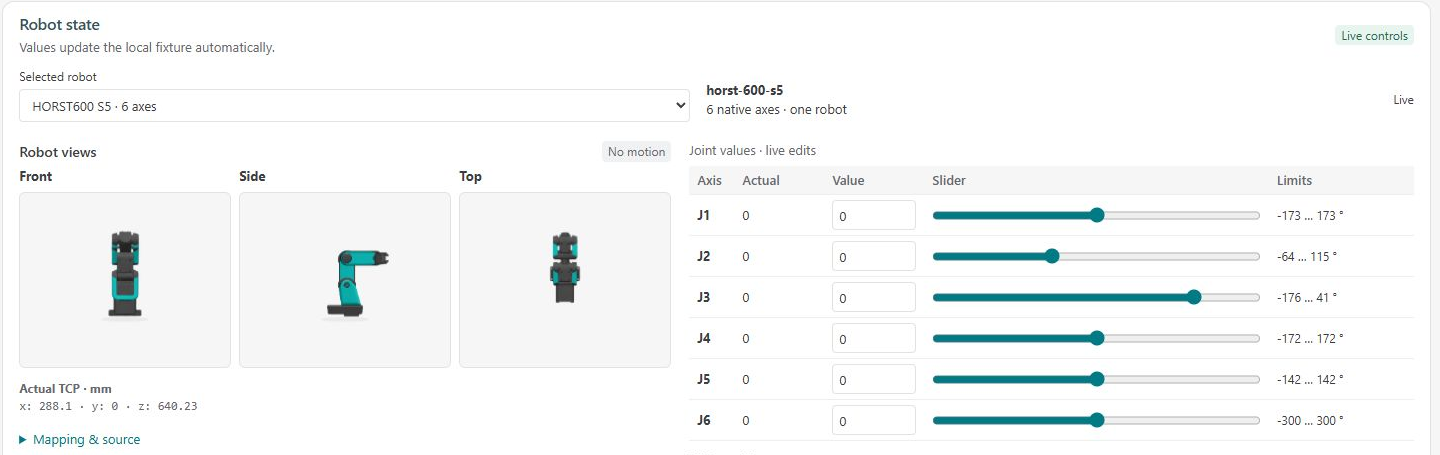
In the Testkit dashboard, find Selected robot and select HORST600 S5 before repeating the status example. In the captured UI it is under Robot; newer dashboard layouts place the selector under PLEXA and the joint values under Robot State. The quickstart checks this specific robot identity. Dashboard controls edit synthetic fixture data.
7. Run the example tests
Open the Command Palette, run Tasks: Run Test Task, then choose PLEXA: Test all 48 RPCs. The task checks TypeScript and runs the fixture integration test with its own fixture lifecycle.
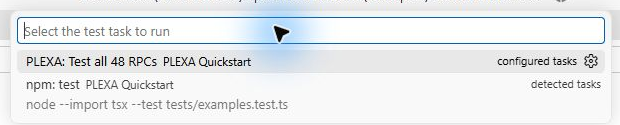
The successful captured run ends with tests 1, pass 1, fail 0. The single test covers the example workflows and all 48 Runtime RPCs. This is a protocol/fixture check, not hardware qualification.

For the equivalent terminal checks, run these commands from the Node folder:
npm run check
npm test
8. Stop the local session
Stop an active debugger with Shift+F5. Then run Tasks: Terminate Task from the Command Palette and choose PLEXA: Start Testkit. Stopping the debugger alone leaves this background task running. A Testkit started manually in a terminal can be stopped with Ctrl+C in that terminal.
Troubleshooting
| Symptom | Next action |
|---|---|
code or node is not found | Open a new terminal after installation. Check VS Code's PATH option and that Node 24 is installed. |
npm ci reports ENOENT for a .tgz | Check that you opened the complete Node quickstart and that packages/ contains the archive named in the error. Update your dev clone or extract the full supplied folder, then repeat npm ci. |
| Tasks or debugging are disabled | Open Workspace Trust and review the known quickstart folder. |
| The PLEXA debug configurations are missing | Open plexa-runtime-node.code-workspace from the Node folder; check that .vscode/launch.json is present. |
A preLaunchTask fails | Open its task terminal and read the first error. For EADDRINUSE, stop the earlier fixture you started for this exercise, then retry F5. |
| You need a second fixture | In .vscode/tasks.json, change the status task's HTTP/gRPC arguments and its readiness endsPattern together. In .vscode/launch.json, update PLEXA_RUNTIME_URL for every status/stream/preview profile using that task. Use the same HTTP port for the dashboard. |
| F5 waits although the Testkit is ready | Compare the actual ready message with the task's readiness pattern, including both ports. |
| A breakpoint stays hollow | Select the TypeScript status profile, open the local examples/read-status.ts and let the pre-launch type check complete. |
| The example rejects the selected robot | Choose HORST600 S5 in the dashboard, or restart the default status fixture. |
| The dashboard stops responding | Check the PLEXA: Start Testkit task is still running and that the browser uses its HTTP port. |
Continue
Return to the Node.js SDK for the client lifecycle and API reference. Use your system's supplied connection configuration when moving on to a physical robot.
The screenshots were captured on 9 November 2026 with VS Code 1.142.0, Node.js 24.22.0, Node SDK 0.1.0, Testkit 0.5.1 and Runtime API 0.9.0. VS Code uses English labels in the captures; the labels above match that UI.